6-33
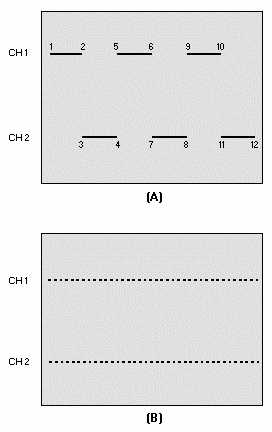
Figure 6-37.—Displaying CHOP mode.
Dashed line CH 1 is the output of one channel, while line CH 2 is the output of the other. The trace
moves from left to right because of the sawtooth waveform applied to the horizontal plates. A more
detailed analysis shows that the beam moves from CH 1 to CH 2 while the gate is connected to the output
from one channel. Then, when the gate samples the output of the CH 2 during time 3 to 4, the beam is at a
different vertical LOCATION. (This is assuming that CH 2 is at a different voltage reference.) The beam
continues in the sequence 5 to 6, 7 to 8, 9 to 10, and 11 to 12 through the rest of one horizontal sweep.
When the chopping frequency is much higher than the horizontal sweep frequency, the number of
dashes will be very large. For example, if the chopping occurs at 100 kilohertz and the sweep frequency is
1 kilohertz, each horizontal line would then appear as a series of closely spaced dots, as shown in figure
6-37 view B. As the sweep frequency becomes lower compared to the chopping frequency, the display
will show apparently continuous traces; therefore, the CHOP mode is used at low sweep rates.
When signals are applied to the channel amplifiers (view A of figure 6-38), the outputs are changed
according to the triggering signal (view B). The resultant pattern (view C) on the screen provides a time-
base presentation of the signals of each channel.