2-7
Figure 2-2D.—Frequency response curves.
Now look at view (C). This frequency-response curve is for an rf amplifier. The frequency limits of
this amplifier are 100 kilohertz (f1) and 1 megahertz (f2); therefore, the bandwidth of this amplifier is 900
kilohertz.
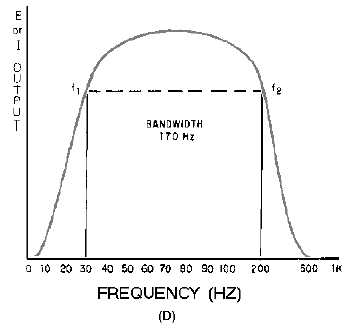
View (D) shows another audio amplifier. This time the frequency limits are 30 hertz (f1) and 200
hertz (f2). The bandwidth of this amplifier is only 170 hertz. The important thing to notice in view (D) is
that the frequency scale is different from those used in other views. Any frequency scale can be used for a
frequency-response curve. The scale used would be determined by what frequencies are most useful in
presenting the frequency-response curve for a particular amplifier.
Q-1.
What is the bandwidth of an amplifier?
Q-2.
What are the upper and lower frequency limits of an amplifier?
Q-3.
What are the upper and lower frequency limits and the bandwidth for the amplifiers that have
frequency-response curves as shown in figure 2-3?