2-5
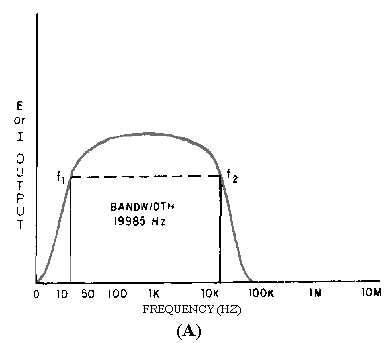
On figure 2-1, the two points marked f
1
and f2 will enable you to determine the frequency-response
limits of the amplifier. In this case, the limits are 15 hertz (15 Hz) and 20 kilohertz (20 kHz). You should
now see how a frequency-response curve can enable you to determine the frequency limits and the
bandwidth of an amplifier.
READING AMPLIFIER FREQUENCY-RESPONSE CURVES
Figure 2-2 shows the frequency-response curves for four different amplifiers. View (A) is the same
frequency-response curve as shown in figure 2-1. View (B) is the frequency-response curve of an
amplifier that would also be classified as an audio amplifier, even though the curve is not "flat" from 15
hertz to 20 kilohertz and does not drop off sharply at the frequency limits. From the curve, you can see
that the lower frequency limit of this amplifier (f1) is 100 hertz. The upper frequency limit (f
2) is 10
kilohertz. Therefore, the bandwidth of this amplifier must be 10 kilohertz minus 100 hertz or 9900 hertz.
Most amplifiers will have a frequency-response curve shaped like view (B) if nothing is done to modify
the frequency-response characteristics of the circuit. (The factors that affect frequency response and the
methods to modify the frequency response of an amplifier are covered a little later in this chapter.)
Figure 2-2A.—Frequency response curves.