3-36
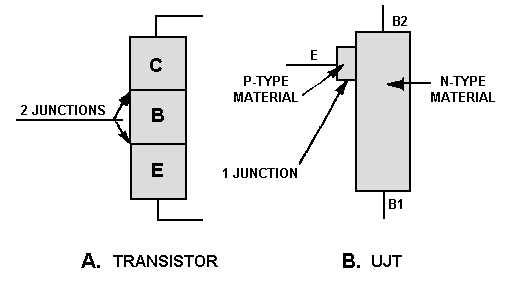
Figure 3-40.—Transistor and UJT structure.
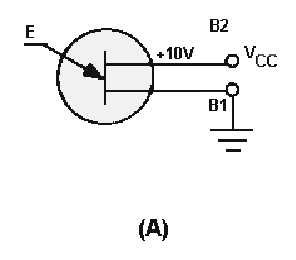
The normal bias arrangement for the UJT is illustrated in figure 3-41, view A. A positive 10 volts is
placed on base 2 and a ground on base 1. The area between base 1 and base 2 acts as a resistor. If a
reading were taken between base 1 and base 2, the meter would indicate the full 10 volts as shown in
view B. Theoretically, if one meter lead were connected to base 1 and the other lead to some point
between base 1 and base 2, the meter would read some voltage less than 10 volts. This concept is
illustrated in figure 3-42, view A. View B is an illustration of the voltage levels at different points
between the two bases. The sequential rise in voltage is called a voltage gradient.
Figure 3-41A.—UJT biasing.