3-20
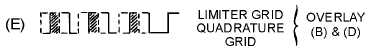
Figure 3-18E.—Gated-beam detector waveforms.
Figure 3-18F.—Gated-beam detector waveforms.
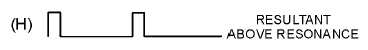
Now consider what happens with a deviation in frequency at the input. If the frequency increases, the
frequency across the quadrature tank also increases. Above resonance, the tank appears capacitive to the
induced current; voltage then lags the applied voltage by more than 90 degrees, as shown in view (G).
Note in view (H) that the two grid signals have moved more out of phase and the average plate current
level has decreased.
Figure 3-18G.—Gated-beam detector waveforms.
Figure 3-18H.—Gated-beam detector waveforms.
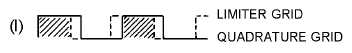
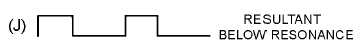
As the input frequency decreases, the opposite action takes place. The two grid signals move more in
phase, as shown in view (I), and the average plate current increases, as shown in view (J).
Figure 3-18I.—Gated-beam detector waveforms.
Figure 3-18J.—Gated-beam detector waveforms.
View (K) shows the resultant plate-current pulses when an fm signal is applied to a gated-beam
detector. Plate load resistor R4 and capacitor C6 form an integrating network which filters these pulses to
form the sine-wave output.