2-11
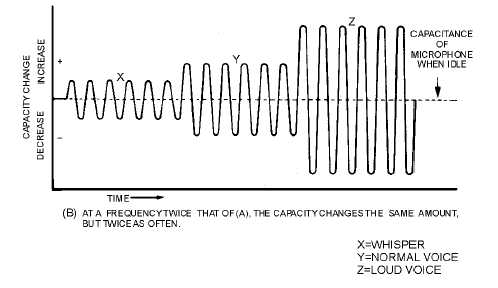
Figure 2-7B.—Capacitance change in an oscillator circuit during modulation. AT A FREQUENCY TWICE THAT
OF (A), THE CAPACITY CHANGES THE SAME AMOUNT, BUT TWICE AS OFTEN.
Figure 2-8 shows how the frequency shift of an fm signal goes through the same variations as does
the modulating signal. In this figure the dimension of the constant amplitude is omitted. (As these
remaining waveforms are presented, be sure you take plenty of time to study and digest what the figures
tell you. Look each one over carefully, noting everything you can about them. Doing this will help you
understand this material.) If the maximum frequency deviation is set at 75 kilohertz above and below the
carrier, the audio amplitude of the modulating wave must be so adjusted that its peaks drive the frequency
only between these limits. This can then be referred to as 100-PERCENT MODULATION, although the
term is only remotely applicable to fm. Projections along the vertical axis represent deviations in
frequency from the resting frequency (carrier) in terms of audio amplitude. Projections along the
horizontal axis represent time. The distance between A and B represents 0.001 second. This means that
carrier deviations from the resting frequency to plus 75 kilohertz, then to minus 75 kilohertz, and finally
back to rest would occur 1,000 times per second. This would equate to an audio frequency of 1,000 hertz.
Since the carrier deviation for this period (A to B) extends to the full allowable limits of plus and minus
75 kilohertz, the wave is fully modulated. The distance from C to D is the same as that from A to B, so
the time interval and frequency are the same as before. Notice, however, that the amplitude of the
modulating wave has been decreased so that the carrier is driven to only plus and minus 37.5 kilohertz,
one-half the allowable deviation. This would correspond to only 50-percent modulation if the system
were AM instead of fm. Between E and F, the interval is reduced to 0.0005 second. This indicates an
increase in frequency of the modulating signal to 2,000 hertz. The amplitude has returned to its maximum
allowable value, as indicated by the deviation of the carrier to plus and minus 75 kilohertz. Interval G to
H represents the same frequency at a lower modulation amplitude (66 percent). Notice the GUARD
BANDS between plus and minus 75 kilohertz and plus and minus 100 kilohertz. These bands isolate the
modulation extremes of this particular channel from that of adjacent channels.