5-13
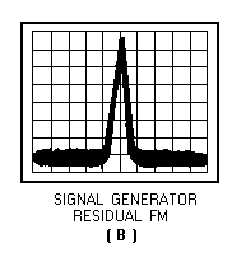
Figure 5-10B.—Spectrum analyzer stability measurements.
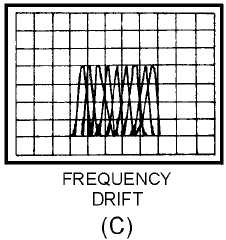
Figure 5-10C.—Spectrum analyzer stability measurements.
The swept-frequency response of a filter or amplifier and the swept-distortion measurement of a
tuned oscillator are also measurable with the aid of a spectrum analyzer. However, in the course of these
measurements, a variable persistence display or an X-Y recorder should be used to simplify readability.
Examples of tuned-oscillator harmonics and filter response are illustrated in figure 5-11. Frequency-
conversion devices such as mixers and harmonic generators are easily characterized by such parameters
as conversion loss, isolation, and distortion. These parameters can be displayed, as shown in figure 5-12,
with the aid of a spectrum analyzer.