4-12
Before any measurements of receiver sensitivity can be made, the receiver must be accurately tuned
to the transmitter frequency. If the receiver frequency differs from the transmitter frequency, the most
likely cause is an improperly adjusted or malfunctioning local oscillator or transmitter frequency drift.
Such problems can be caused by heat or aging components. Local oscillator tuning procedures differ
widely according to the type of radar system; therefore, you should follow the tuning procedures in the
system maintenance manuals.
Two basic methods are used to measure radar receiver sensitivity. One is the PULSE METHOD, in
which a pulse of measured amplitude and width is coupled to the receiver. In the second method, you use
an fm generator to vary the signal generator output frequency across the receiver bandwidth. This latter
method ensures the test signal is within the bandpass of the receiver.
The sensitivity of the receiver is equal to the sum of the reading on the signal generator and the
attenuations of the connecting cable and directional coupler. Receiver sensitivity is expressed as a
negative dBm; for example, -90 dBm expresses the sensitivity of a receiver that can detect a signal 90 dB
less than the 1-milliwatt reference level. A typical receiver sensitivity reading on a modern radar should
be in the vicinity of -105 dBm.
RECEIVER BANDWIDTH TEST
Receiver bandwidth is defined as the frequency spread between the half-power points on the receiver
response curve. Receiver bandwidth is specified for each radar, but wide variations are often tolerated. If
either the bandwidth or the shape of the receiver response curve is not within tolerances, a detailed check
of circuit components may be necessary. A considerable change in the value of circuit components is
required to alter the response. You should check receiver response after any extensive repair to an IF
amplifier.
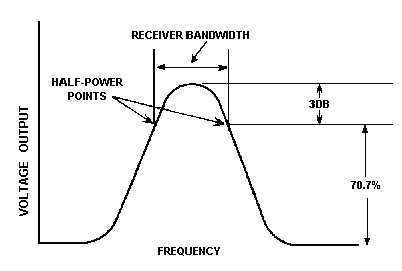
Figure 4-9 shows a typical response curve of a radar receiver. The half-power points are shown as 3
dB below maximum response. Since the curve is plotted in terms of voltage, these points are also
represented by the 70.7 percent voltage points as shown in the figure.
Figure 4-9.—Typical receiver response curve.