4-16
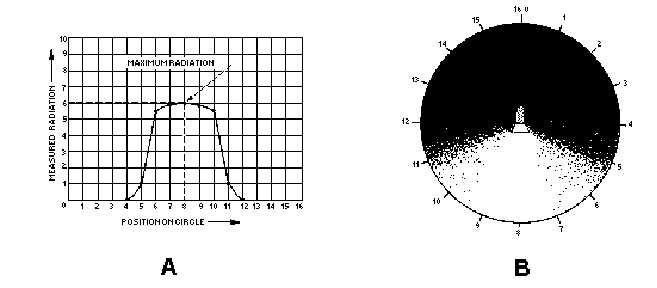
Figure 4-11.—Anisotropic radiator.
Directly behind the flashlight (position 0) the radiation measured is minimum. Accordingly, a 0
value is assigned to this position in the rectangular-coordinate graph (fig. 4-11, view A). This radiation
remains at minimum until position 4 is reached. Between positions 4 and 6, the measuring device enters
the flashlight beam. You can see this transition from darkness to brightness easily in view B. Radiation is
fairly constant between positions 6 and 10. Maximum brightness occurs at position 8, which is directly in
the path of the flashlight beam. From positions 10 to 12, the measuring device leaves the flashlight beam
and the radiation measurement falls off sharply. At position 13 the radiation is again at 0 and stays at this
value back to position 0.
Radiation from a light source and radiation from an antenna are both forms of electromagnetic
waves. Therefore, the measurement of radiation of an antenna follows the same basic procedure as that
just described for the Sun and the flashlight. Before proceeding further with the study of antenna patterns,
you should be sure you understand the methods used to graph the measured radiation (magnitude of the
radiation). Study the rectangular- and polar-coordinate systems of plotting presented in the following
section.
Q13. What is the radiation resistance of a half-wave antenna in free space?
Q14. A radiating source that radiates energy stronger in one direction than another is known as what
type of radiator?
Q15. A radiating source that radiates energy equally in all directions is known as what type of
radiator?
Q16. A flashlight is an example of what type of radiator?
In figure 4-11, view A, the radiation pattern of the flashlight is graphed in rectangular coordinates.
The illustration of the flashlight beam in view B clearly indicates the shape of the flashlight beam. This is
not evident in the radiation pattern plotted on the rectangular-coordinate graph. Now look at figure 4-12.
The radiation pattern shown in this figure looks very much like the actual flashlight beam. The pattern in
figure 4-12 is plotted using the same values as those of figure 4-11, view A, but is drawn using polar
coordinates.